SST, Inc.™
7979 Gateway Boulevard
Suite 210
Newark, California 94560
+1.888.274.6877 | Toll Free
+1.510.794.3144 | General Information & Sales
info@shotspotter.com ·
www.shotspotter.comMore Information about SST and ShotSpotter can be found at
www.SST-Inc.com
or
www.ShotSpotter.com. The National Gunfire Index eBooks can be downloaded at www.ShotSpotter.com/ngi. You can also follow SST and ShotSpotter solutions on
Twitter,
YouTube,
Facebook, and
LinkedIn.
All rights reserved. ShotSpotter® Flex℠, ShotSpotter® SiteSecure™, ShotSpotter®, SST™ SecureCampus, and the ShotSpotter logo are registered trademarks of
SST, Inc.™, SST and ShotSpotter technology are protected by one or more issued U.S. and foreign patents, with other domestic and foreign patents pending,
as detailed at
www.ShotSpotter/patents.com.
Leveraging Technology to produce Societal Benefits
As technology continues to advance, balancing its benefits against some of its inherent risks to privacy continues to be an issue which confronts us all. What’s true for technology in general is also the case in the realm of public safety. Technological advances have provided significant benefits to those tasked with keeping us safe while at the same time raising appropriate dialogue about how we can leverage those benefits while minimizing unwarranted intrusions on personal privacy.
Several police tools and technologies capture information that is already in public view: license plate readers, video cameras at stoplights and ATMs, combined video/audio surveillance cameras, facial recognition algorithms, etc. Unlike general audio and video surveillance devices, such as the tens of thousands of video cameras deployed in our nation’s cities which monitor general activities, gunshot detection technology is designed to trigger on loud explosive or impulsive sounds that may likely be gunfire and occur only rarely—and that the public already “hears”. Although courts have held that individuals speaking in a manner which can be overheard on public streets do not have the expectation of privacy which would trigger federal wiretapping laws, SST wants to provide stronger protection of individual rights to privacy than is strictly provided for by law. As a result, we developed, and recently strengthened, this privacy policy in order to exceed federal law requirements and to protect individual privacy.
Sensors
Please note: this section refers to the SST ShotSpotter outdoor gunfire detection technology. Indoor sensors are entirely different and provide additional privacy protections.
ShotSpotter sensors are specifically designed to be triggered by loud explosive or “impulsive” sounds only. The entire system is intentionally designed not to permit “live listening” of any sort. Human voices do not trigger ShotSpotter sensors. There are many other loud noises that do not trigger ShotSpotter: car doors slamming, people yelling “bang bang!”, loud music, airplane engines, leaf blowers, cheering, highway noise, car engines revving, drag races or tires squealing.
In addition, sensors are intentionally deployed in elevated locations (typically 50-100 feet above street level on building rooftops, sometimes 30-40 feet above ground on a street pole) for three reasons:
1) to maximize their ability to “listen to the horizon” and thereby reduce the number of sensors required;
2) to minimize the background noise from cars and other street noises, thus also reducing the number of sensors required; and
3) to minimize the chance that a human voice will be intelligible, however briefly, in order to protect privacy.
ShotSpotter sensors do not use “high gain,” directional, or other specialized microphones.
The microphones themselves are similar to those in a mobile phone. When spoken outdoors at distances in excess of approximately 10 feet, a private conversation spoken in a normal voice is simply not intelligible to a human, to a mobile phone, or to ShotSpotter sensors. This is an intentional engineering and design choice made to ensure that ShotSpotter sensors cannot be used to monitor private conversations. It would be safe to say that an individual walking down the street and speaking into a mobile phone is more likely to unintentionally overhear and transmit the private conversation of someone else walking and talking nearby than that a ShotSpotter sensor, far further away, and only triggered by loud, impulsive noises, would be.
Incident Creation
When a loud explosive noise triggers a sensor, it instantly sends summary data about the acoustic event (e.g. time stamp, sensor location, amplitude and envelope characteristics, etc. but explicitly not the audio of the sound itself) to a centralized processor at our SST-operated data center. There, if no other sensors trigger (i.e., if only one sensor hears the particular impulse), nothing else happens and no incident is created. If multiple sensors (usually 3 or more) report impulsive noises within a narrow time window which are sufficiently loud and mathematically consistent with their having originated at a single location, software algorithms attempt to calculate that origin location. If an accurate location can be determined, the associated sensors’ data are aggregated (again, without the audio) and an incident is “created” in a centralized database. A second filter then applies artificial intelligence and statistical techniques to attempt to identify what type of sound originated at this location based on the measurements of the sound. In most cases, the parameters of the sound permit the incident to be filtered out, because it is, e.g., a pile driver or a jackhammer. In a percentage of cases, the characteristics of the sound are consistent with an explosion (gunfire, firework mortar, firecracker, backfire, etc.). In those cases, and only in those cases, the sensors are permitted to push a small snippet of audio to our data center. Otherwise, the audio will be flushed from the sensor’s buffer and lost permanently. This is an intentional privacy-driven design: an active step must be taken only in the context of an explosive triggering acoustic event, or the audio is erased and overwritten.
In those cases in which an explosive triggering acoustic event is detected and located, the brief audio snippets are sent to SST’s Real Time Incident Review Center (IRC) for analysis and alert qualification by highly trained experts in gunshot acoustics. Within seconds, SST’s IRC sends those qualified gunfire alerts directly to a dispatch center, PSAP, patrol officers or other agencies for an effective, coordinated response. The gunfire alerts that the ShotSpotter system delivers to our police agency clients provide a digital record of violent gun crimes in progress, including minimally brief snippets of audio recordings of those crimes. For any given illegal gunfire incident, that snippet can only contain a few seconds of audio before the first shot and after the last shot. The purpose of these short seconds of audio on either end of the gunshots is to allow a human reviewing in the incident to clearly tell when the shooting starts and stops, including judges and juries during possible future criminal proceedings.
No Live Audio Streaming
As mentioned above, the entire system is intentionally designed not to allow “live listening” of any sort. There is no “listen” button available to law enforcement, or to the staff of our Incident Review Center, except the buttons which replay the specific few seconds of incident audio surrounding an impulse noise determined to likely have originated from an explosive source.
No Private Conversations
ShotSpotter sensors do not have the ability to listen to indoor conversations. They do not have the ability to overhear normal speech or conversations on public streets. Recently, privacy zealots have pointed to three extremely rare “edge cases” (3 out of approximately 3 million incidents detected in the past 10 years), in which a human voice yelling loudly in a public street at the scene of a gunfire incident was overheard for a very brief period (a few seconds). They have inaccurately assumed that ShotSpotter sensors are constantly transmitting audio streams, or somehow have been reconfigured to listen to private conversations. That simply isn’t true. In one of these three cases, only two words were overheard; in the others, a sentence was heard before the gunshot and in the other a similar number of words were heard immediately after a gun shot. In all cases, the words were yelled loudly, in a public place, at the scene of a gunfire-related crime, and within a few seconds of that event.
Nonetheless, these rare cases caused SST to revisit our privacy policy and further tighten the parameters for audio availability: the permitted audio length is strictly limited to two seconds before and four seconds after. Unless someone is yelling loudly enough to be heard in public, and also doing so within two seconds before or four seconds after a loud, explosive acoustic incident, the audio will be flushed from the sensor’s buffer and overwritten. The simple fact is that there has never been a case of a private conversation overheard or monitored by any ShotSpotter sensor anywhere at any time. Period.
Policy and Security Minutiae
If you are still with us, here are some additional details:
All servers and software used to process, store and protect data are managed and maintained by SST. Police agencies subscribe to the hosted service on an annual basis, radically streamlining the cost and complexity of using gunfire alert and analysis to enhance awareness, response and community safety. SST owns these data and does not release to anyone other than the customers under contract and according to the terms of that contract, thus further ensuring the safety and security of the data. Customers do not have administrative access to our servers, software, sensors, or any other means to circumvent SST’s security and privacy measures.
SST has taken appropriate security approaches to prevent anyone or any entity from gaining unauthorized access to our systems including our processors, networks or sensors. In addition to the fact that the system is designed not to permit live streaming audio, even if an intruder were to take control of our data center and network, they could not “make” a sensor deployed in the field stream audio. It simply isn’t possible: the sensors operate on a proprietary protocol and intentionally do not contain code which permits them to stream audio. Asymmetric key encryption is used to control access to sensors, and SST employees are required to use dual-factor authentication to gain access to most critical systems.
In the event that the ShotSpotter system fails to detect an incident, it is SST’s policy only to respond to requests for incident data or audio related to specific, verified gunfire incidents. In no event does incident audio extend beyond 2 seconds before and 4 seconds after an incident.
In addition to all of these technical and security measures taken to protect privacy and prevent misuse, SST has adopted a human resources policy to ensure that employees and contractors adhere to our privacy policies.
Summary
In the end, we believe that the privacy of our citizens and the community and social benefits of decreased gun violence are not at odds with each other. Our ultimate goal is to ensure that both are satisfied. We believe we have taken all reasonable and necessary precautions to assure a robust and strong privacy posture. We will continue to review, revise—and strengthen if necessary—these policies.
Methodology and Notes
1. The 56 communities that had ShotSpotter Flex coverage as of June 30, 2014 are included in the first half analysis in this report.
2. In order to perform an ‘apples-to-apples’ comparison of gunfire rates during 1H2013 and 1H2014, only those 31 communities that had ShotSpotter Flex coverage for more than 98 days in both 1H2013 and 1H2014 are used in the comparison.
Some communities were not covered during the entire six months in 1H2013 or 1H2014. Therefore, when calculating values such as gunfire incidents per square mile, care was taken to account for the different number of days of coverage for different communities. In these few cases, the chosen solution was to calculate the number of incidents by day and impute the number of gunfire incidents for those days for which there was no coverage, taking account known information about incident rates for the community, the day of the year, the day of the week, and the year. This method is like proration, but is more accurate. Imputation of incidents data for a half is done only for communities that have coverage data for more than 98 days in that half.
3. The incident data for Youngstown, OH and for Suffolk County (Amityville), and Suffolk County (Wyandanch), NY were are not used in the 1H2013 vs. 1H2014 comparisons because of changes to the coverage areas which would have made this comparison not ‘apples-to-apples’.
4. Incidents were counted only after formal qualification and operational use of ShotSpotter data by the client agency began, even if gunfire or other incidents were detected previously. Incidents were counted as gunfire if they were classified as Single Gunfire, Multiple Gunfire, or Possible Gunfire by SST-certified review personnel. All other incident types (fireworks, firecrackers, explosions unrelated to gunfire, transformer explosions, thunder, lightning, helicopters, etc.) are not classified as confirmed gunfire and were excluded from all statistics presented in this report. Gunfire incidents not reviewed by SST-certified review personnel are also excluded.
ShotSpotter data does not remain static, as information and adjustments are often made several days or weeks after initial detection (as forensic evidence is analyzed, cases are investigated, etc.). This report takes into account the most accurate and recently-available information.
5. Square mileage is measured on the basis of contractual coverage area. For each such area, the geographic area is defined as the convex hull surrounding each coverage area. If the convex hulls data are not available, the contracted area is used. In some cases, small areas within these coverage areas are intentionally excluded when gunfire is regularly expected in those specific locations (e.g. a legal outdoor shooting range or police practice range). In those cases, gunfire which takes place in those locations outside of authorized areas is still included in the tallies, but gunfire which takes place during permitted (expected) periods is not included.
6. Gunfire incidents for a half year period were counted if the local time in the time zone of their occurrence was between 00:00:00 standard time (i.e., midnight) on January 1 and 23:59:59 daylight saving’s time on June 30 (i.e., 1 second before midnight on July 1).
Incidents during the New Years and 4th of July holiday periods are not counted in the statistics unless explicitly noted because because gunfire during those holiday periods is highly inconsistent with the normal pattern. The holiday periods are from January 1, 00:00:00 to January 1, 06:00:00 and from June 30, 12:00:00 to June 30, 23:59:59.
7. When the Friday, Saturday and Sunday gunfire totals are compared to the rest of the week, a day is defined as starting at 06:00:00 local time and extending to 05:59:59 the next morning. For example, early 02:05 Sunday morning is counted as Saturday night.
8. Individual hours of the week and days of the week were calculated on a local time basis.
For Immediate Release
SHOTSPOTTER REPORTS MORE THAN 25 PERCENT REDUCTION IN GUNFIRE INCIDENTS
ACROSS U.S. DURING FIRST HALF OF 2014
Fast Police Response to Gunfire Crimes in Progress Is Key to Decrease
NEWARK, Calif. – October 8, 2014 – SST, Inc., the maker of ShotSpotter Flex™ and the global leader in gunfire detection and analysis, today announced that its National Gunfire Index revealed that gunfire incidents during the first half of 2014 are down by 25.9 percent, compared to first half of 2013, in the 31 communities across the U.S. where ShotSpotter was deployed during both periods.
Year-on-Year Comparison of 31 Communities
During the first half of 2014, SST reported 11,675 gunfire incidents occurred in the 107.6 square miles in those areas; down from 14,703 in the same period in 2013 over 98.6 square miles. Gun incidents in the sample area were down 25.9 percent even though some cities increased their coverage area. Gunfire incidents per square mile decreased from 149.1 to 108.5 from the first half of 2013 versus the first half of 2014. The SST National Gunfire Index compares gunfire incidents from the first half of 2014 to the first half of 2013 in the key locations that have consistently used ShotSpotter since before January 1, 2013. The sample represents an “apples to apples” comparison of the same 31 areas.
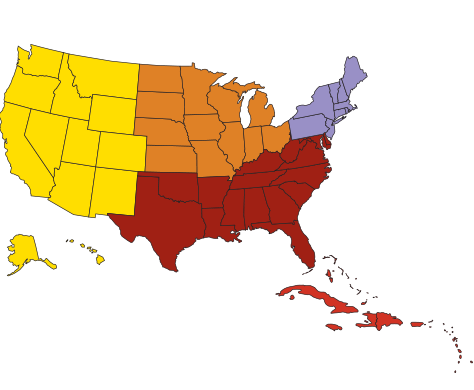
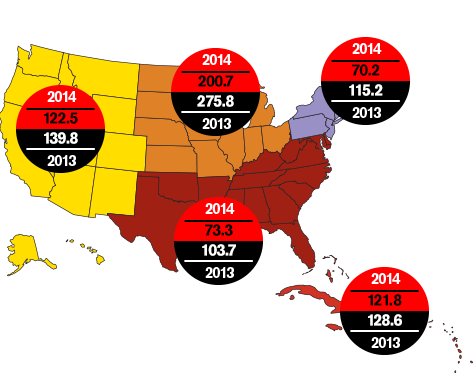
Every region in the sampling of 31 communities where ShotSpotter is in use saw a decrease in incidents per square mile from an average of 125 per square mile in the first six months of 2013, to 82.7 per square mile in the first six months of 2014. The Northeast had the largest percentage decrease – down 39.1 percent, and the Midwest saw the greatest decrease in absolute number of gunfire incidents, down from 275.8 to 200.7 incidents per square mile.
“The gunfire index data is extremely encouraging and suggests what cities and their law enforcement agencies can accomplish with a comprehensive gun violence reduction effort focused on enhanced response and community engagement,” said Ralph A. Clark, President and CEO of SST.
ShotSpotter Results Overall
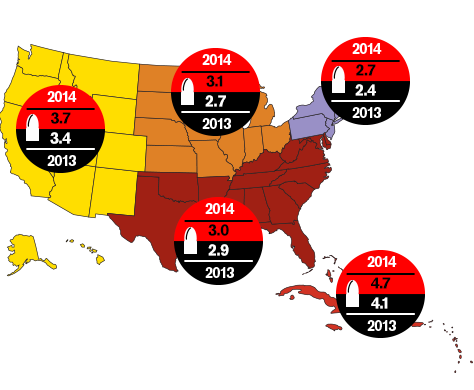
Currently 85 police departments nationwide use ShotSpotter to help combat illegal urban gunfire. In the first half of 2014, ShotSpotter Flex detected a total of 19,946 separate gunfire incidents in its total coverage area. Excluding holidays, there were 17,863 incidents, which equates to 98.2 gunfire incidents every day, or 4.1 incidents every hour. While the number of incidents has declined, at the same time the average number of rounds per incident (3.2) is up around 11 percent, possibly suggesting fewer incidents are coupled with more serious gunfire intentions. Regions varied greatly in the average number of rounds per incident: Caribbean remained the highest and actually increased from 4.1 average rounds per incident to 4.7.
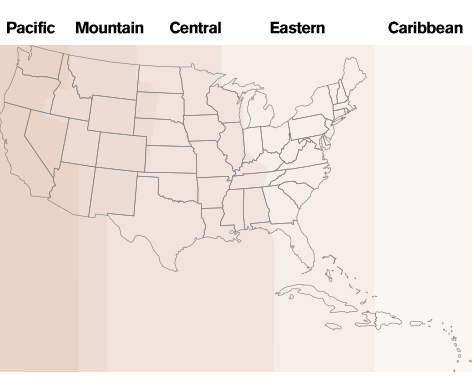
The index also revealed peak shooting times vary among the geographic regions. In the West, peak shooting was at 10:25 PM local time, whereas the Caribbean peaked around 1:00 AM local time. The peak shooting times in ShotSpotter coverage areas account for almost 80 percent of gunfire incidents. Friday, Saturday and Sunday nights account for 53 percent of all gunfire activity.
While gun incidents were down by 25.9 percent in the total sample area of 31 cities, some cities reduced gun incident rates even more significantly. Leading them was Springfield, MA with an overall decrease of 60.4%.
“Having ShotSpotter alerts sent right to our patrol cars is a huge asset because we do not have to wait for our dispatcher to alert officers to a shots fired call – we are en route immediately,” said Police Commissioner John Barbieri of Springfield, MA Police Department, which saw the greatest decrease in gunfire incidents. “We have implemented an automated, proactive strategy for using ShotSpotter that gets us on the scene of crimes in progress fast. In 2013, we started tracking the number of arrests and guns we’ve recovered due solely to ShotSpotter alerts – it’s making a huge difference. Having this technology alert my officers that there is a gun at the scene they are responding to allows them to approach the call cautiously, thus making them safer. You cannot put a price tag on this.”
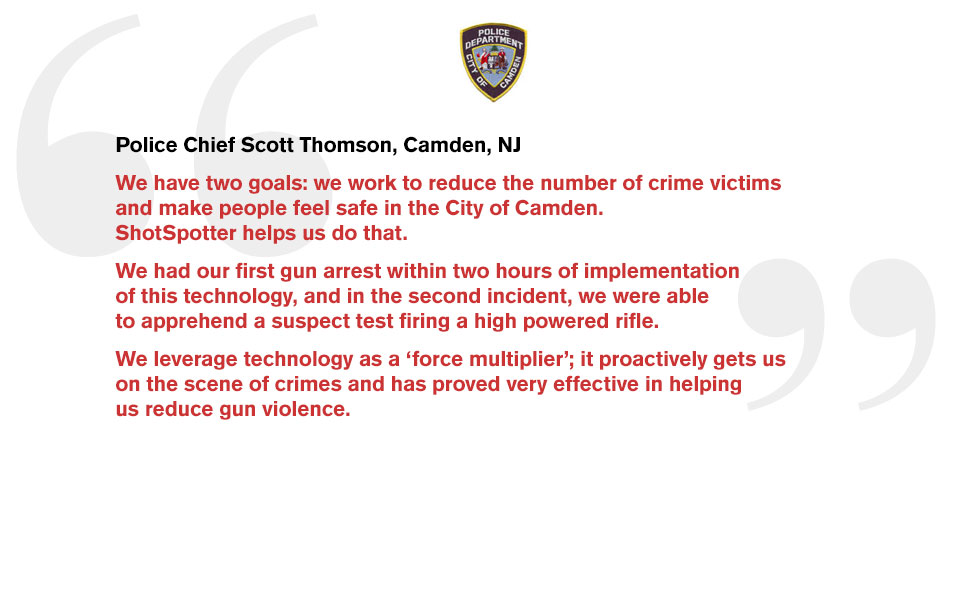
“We have two goals, we work to reduce the number of crime victims and make people feel safe in the City of Camden. ShotSpotter helps us do that,” stated Camden County Police Chief Scott Thomson. “We had our first gun arrest within two hours of implementation of this technology, and in the second incident, we were able to apprehend a suspect test firing a high powered rifle. We leverage technology as a ‘force multiplier’; it proactively gets us on the scene of crimes and has proved very effective in helping us reduce gun violence.”
“Keeping our families and children out of harm’s way is a priority for New Haven,” said Police Chief Dean M. Esserman. “As evidenced from the ShotSpotter National Gunfire Index results, New Haven’s gunfire incidents have dropped 40.6% and we think this is a significant number, indicating that our efforts to reduce gun violence are succeeding. With ShotSpotter our police officers are responding more quickly to incidents, recovering more immediate criminal evidence and effectively tying together more gun violence cases.”
ShotSpotter Flex helps police departments transform their policing practices from reactive to proactive by instantly notifying officers of gunshot crimes in progress with real-time data delivered to dispatch centers, patrol cars and even smartphones. With real-time alerts, first responders receive precise gunfire incident information, allowing informed decisions for faster emergency response while also improving situation intelligence and increasing first responder safety. ShotSpotter gunfire data also enables law enforcement agencies to improve evidence collecting, prosecution and overall police effectiveness.
Currently ShotSpotter is deployed across 85 U.S. communities and the Caribbean, totaling more than 225 square miles of coverage area. The 31 ShotSpotter coverage areas, for which the first half of 2013 and first half of 2014 data were compared and compiled in this latest National Gunfire Index include: Brockton, MA; Camden, NJ; Charlotte, NC; Chicago, IL; East Palo Alto, CA; Fall River, MA; Hartford, CT; Hempstead, NY; Kansas City, MO; Miami Gardens, FL; Milwaukee, WI; New Bedford, MA; New Haven, CT; Oakland, CA; Omaha, NE; Paterson, NJ; Plainfield, NJ; Prince Georges County, MD; Quincy, WA; Rochester, NY; Rocky Mount, NC; Saginaw, MI; San Francisco, CA; St. Croix, USVI; St. Louis, MO; St. Thomas, USVI; Springfield, MA; Suffolk County (Brentwood), NY; Suffolk County (Huntington Station), NY; Suffolk County (N Bellport), NY; Wilmington, NC.
About SST, Inc.
SST, Inc. is the global leader in gunfire detection and location technology providing the most trusted, scalable and reliable gunfire alert and analysis solutions available today. SST ShotSpotter’s inaugural 2013 National Gunfire Index, released in April, revealed that gunshots are both vastly under-estimated and under-reported. SST’s ShotSpotter Flex™ is the leading gunfire alert and analysis solution for detecting gunshots and providing critical intelligence to give law enforcement agencies the detailed real-time data needed to investigate, analyze and prosecute gun related crimes. The company’s deep domain experience, along with cumulative agency best practice experience, delivers measurable outcomes that contribute to reducing gun violence. SST is a proven solution provider with more than 80 installations across the United States and the world. Privately held, the company possesses multiple patents resulting from nearly two decades of innovation in the area of acoustic gunshot location technology.
More Information about SST and ShotSpotter can be found at
www.SST-Inc.com or
www.ShotSpotter.com. The National Gunfire Index eBooks can be downloaded at www.ShotSpotter.com/ngi. You can also follow SST and ShotSpotter solutions on
Twitter,
YouTube,
Facebook, and
LinkedIn.
# # #
Media Contact: Liz Einbinder +1 (415) 577-8255
leinbinder@shotspotter.com